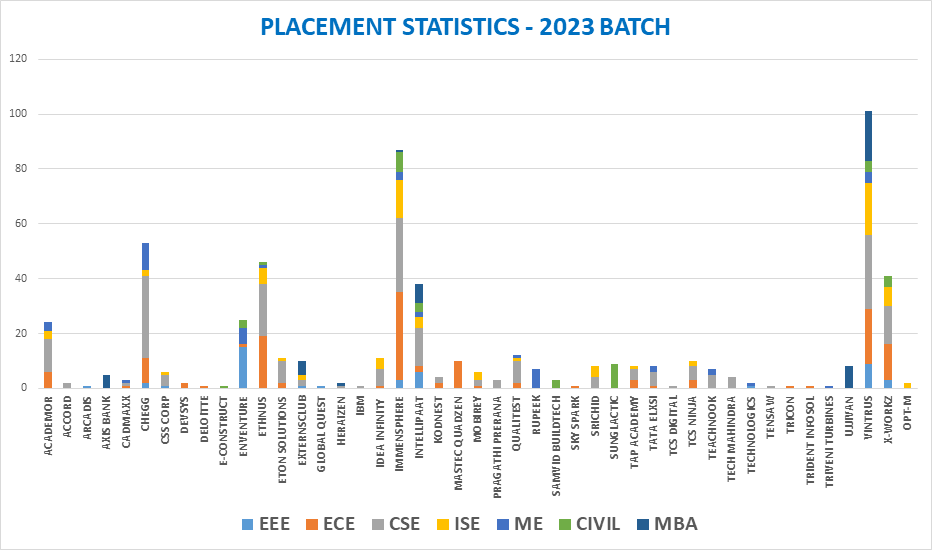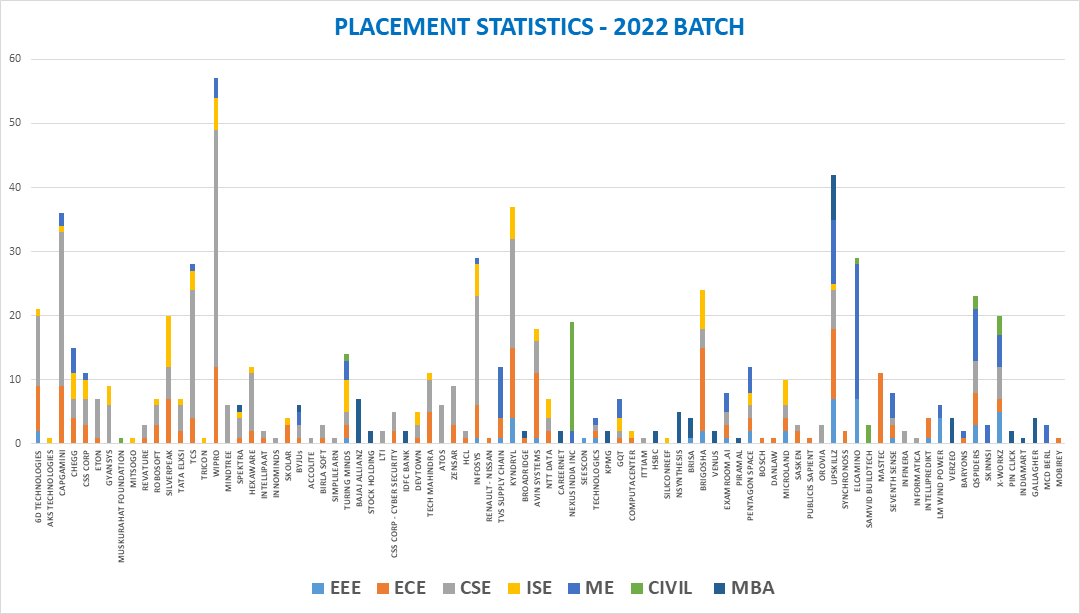
PLACEMENT STATISTITCS
| Particulars | Placement Statistics 2022-2023 | Placement Statistics 2021-2022 |
| No. of Eligible Students | 515 | 574 |
| No. of Students Placed | 331 | 360 |
| Placement Percentage | 64.2% | 62.7% |
| Highest CTC | 8 LPA | 10.4 LPA |
| Average CTC | 3.3 LPA | 3.5 LPA |
| No. of Companies Participated | 92 | 170 |
| IT Companies | 32 | 86 |
| Core (Non-IT) Companies | 60 | 84 |